Nuclear Radius Equation (AQA A Level Physics): Revision Note
Exam code: 7408

Nuclear radius values
The radius of some nuclei are shown in the table below:
Element | Nuclear radius / 10-15 m | Mass number |
|---|---|---|
Carbon | 2.66 | 12 |
Silicon | 3.43 | 28 |
Iron | 4.35 | 56 |
Tin | 5.49 | 120 |
Lead | 6.66 | 208 |
In general, nuclear radii are of the order 10–15 m or 1 fm
The nuclear radius, , varies with nucleon number, as follows:
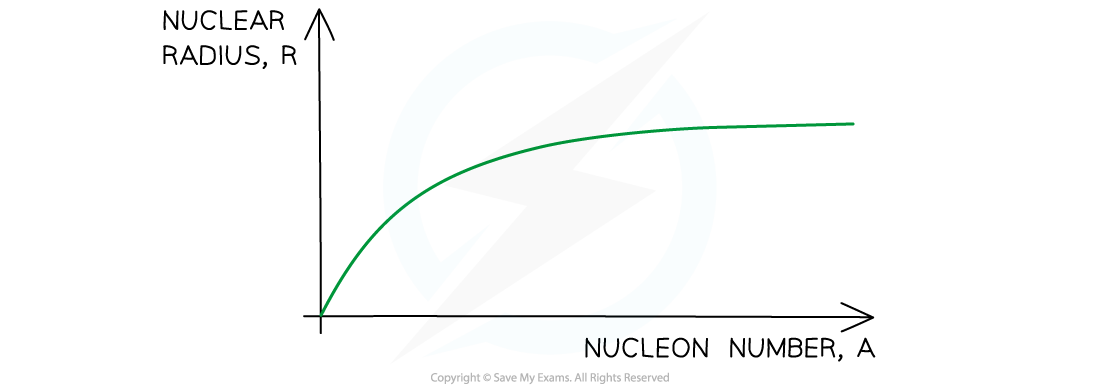
The key features of this graph are:
The graph starts with a steep gradient at the origin
Then the gradient gradually decreases to almost horizontal
This means that:
As more nucleons are added to a nucleus, the nucleus gets bigger
However, the number of nucleons is not proportional to its size
Radius v nucleon number
The radius of nuclei depends on the nucleon number, of the atom
This makes sense because as more nucleons are added to a nucleus, more space is occupied by the nucleus, hence giving it a larger radius
The exact relationship between the radius and nucleon number can be determined from experimental data
By doing this, physicists were able to deduce the following relationship:
Where:
= nuclear radius (m)
= nucleon / mass number
= constant of proportionality = 1.05 fm
Plotting a graph of against gives a straight line through the origin with the gradient equal to

It is also possible to plot a logarithmic graph of the relationship which can be derived as follows:
Therefore, a graph of against yields a straight line
Comparing this to the straight-line equation:
Gradient
y-intercept,

Worked Example
Verify the experimental relationship between and using the data from the table above and estimate a value of .
[3]
Answer:
Step 1: Add a column to the table to determine the values for
Element | Nuclear radius / 10-15 m | Mass number | |
|---|---|---|---|
Carbon | 2.66 | 12 | 2.29 |
Silicon | 3.43 | 28 | 3.04 |
Iron | 4.35 | 56 | 3.83 |
Tin | 5.49 | 120 | 4.93 |
Lead | 6.66 | 208 | 5.92 |
[1 mark]
Step 2: Plot a graph of against and draw a line of best fit
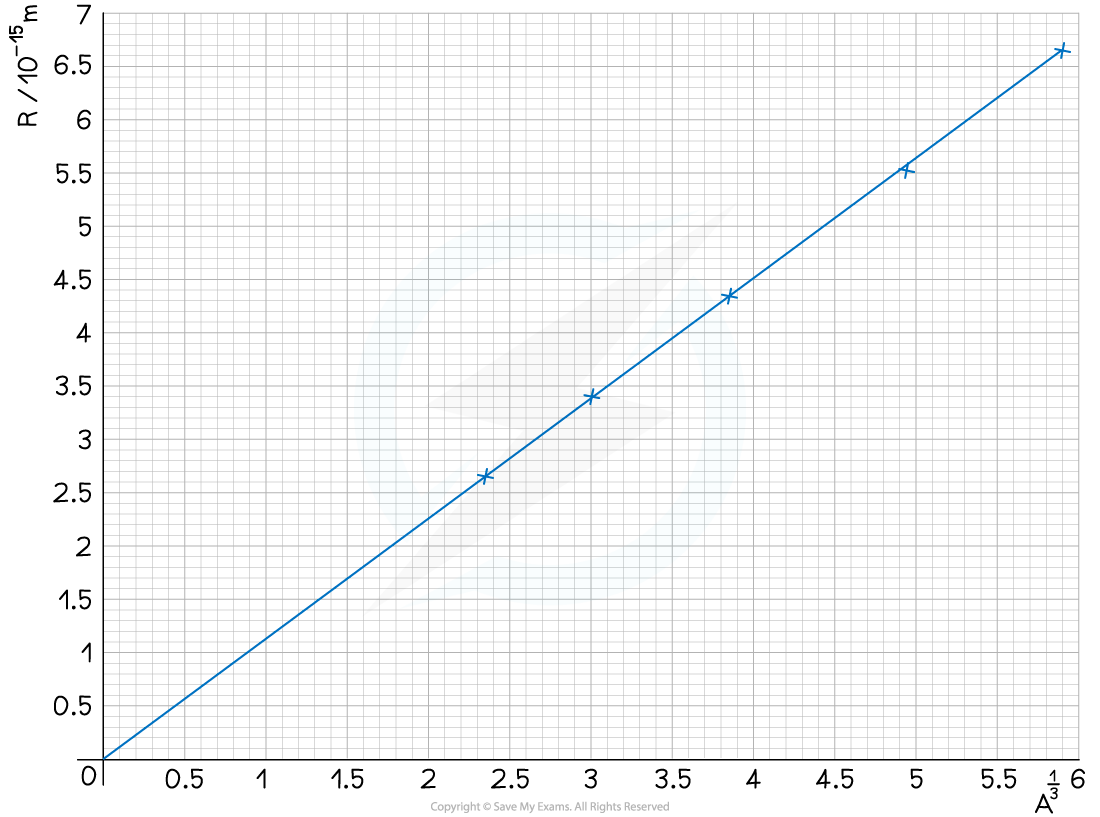
[1 mark]
Step 3: Calculate the gradient
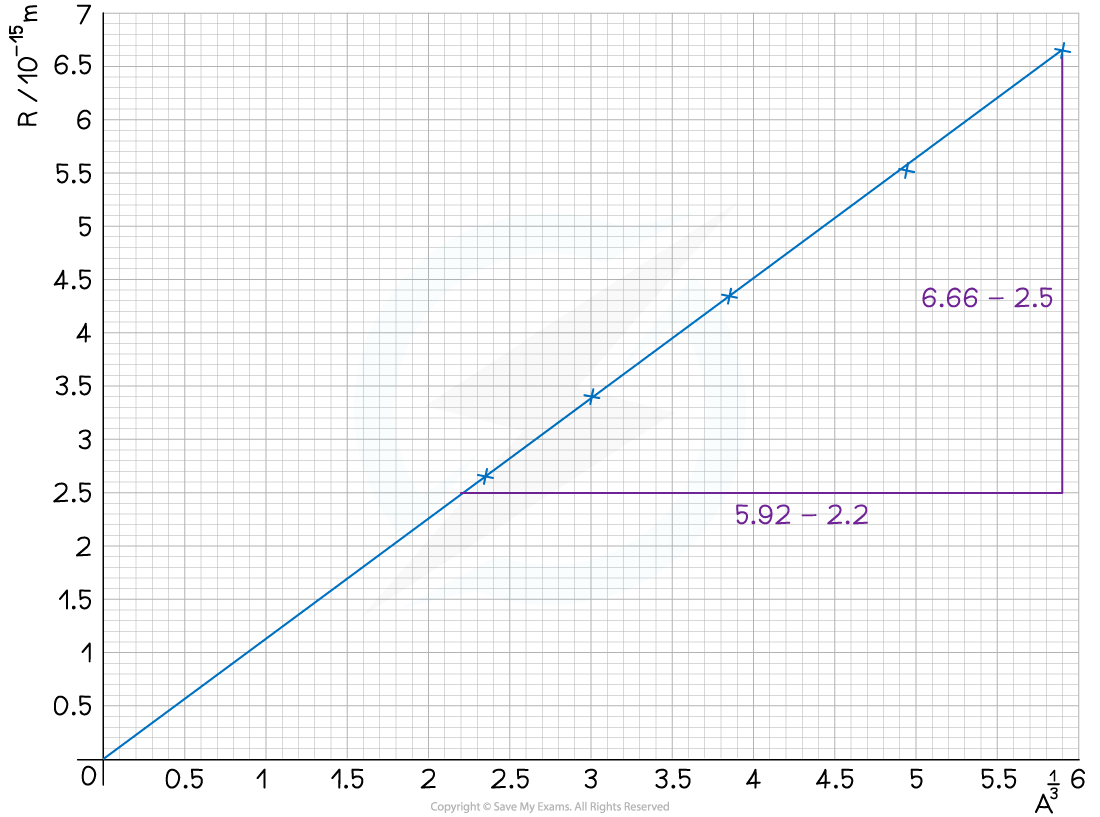
[1 mark]

Unlock more, it's free!
Join the 100,000+ Students that ❤️ Save My Exams
the (exam) results speak for themselves:

Was this revision note helpful?
Build on this topic