Concentration-Time Graphs (College Board AP® Chemistry): Study Guide

Concentration-time graphs
The reaction order can be inferred from a graph of concentration of reactant vs time
Zero-order, first-order and second-order reactions each have a characteristic concentration–time graph
Zero-order reactions
In a zero-order reaction, the concentration of the reactant falls at a constant rate
So, it drops by the same amount in each equal time interval
This means that [A] versus time is a straight line, as shown below
The slope of the [A] versus time line is −k, so k = −(slope)
The rate constant itself is always positive
Concentration-time graph of a zero-order reaction

For a zero-order reaction, concentration falls in a straight line with time until the reactant is used up
First-order reactions
In a first-order reaction, the concentration of the reactant decreases with time
The half-life is constant where [A] takes the same time to fall from its starting value to half as from half to a quarter
The graph is a curve that goes downwards and eventually levels out, as shown below
Concentration-time graph of a first-order reaction

A concentration-time graph of a first-order reaction curves downwards
Examiner Tips and Tricks
To show that a reaction is first order from an [A] versus time graph, read two successive half-lives from the graph and show that they are equal. ‘It has a half-life’ or ‘the concentration decreases’ is not evidence because every order has both
Second-order reactions
In a second-order reaction, the concentration also falls along a curve
The curve looks similar to a first-order curve, so first and second order cannot be told apart reliably by eye
Plot ln[A] and 1/[A] against time and see which plot is linear (see Manipulating Concentration-Time Graphs)
Concentration-time graph of a second-order reaction
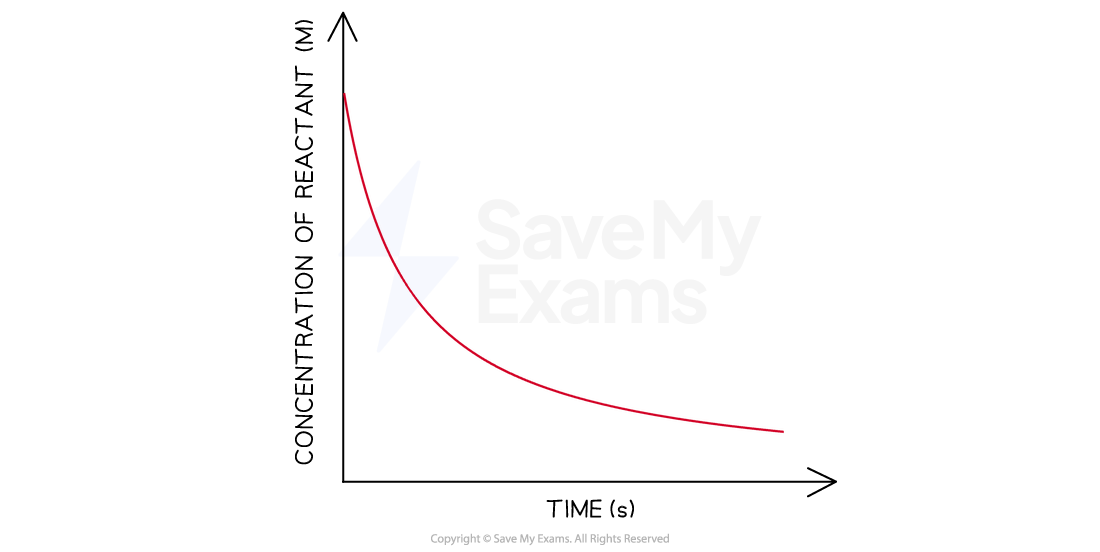
A second-order concentration–time graph is a curve that flattens more and more slowly; a 1/[A] versus time plot confirms second order
Examiner Tips and Tricks
To decide the order from graphs, name the plot that is linear:
[A] versus t (zero order)
ln[A] versus t (first order)
1/[A] versus t (second order)
Do not just say ‘the graph on the right is linear’. A linear 1/[A] plot means second order, not third order

Unlock more, it's free!
Join the 100,000+ Students that ❤️ Save My Exams
the (exam) results speak for themselves:

Was this revision note helpful?
Build on this topic